DATA VISUALIZATION AND REPORTING AT BURKE, INC.
BURKE’S FIRST DESIGNER
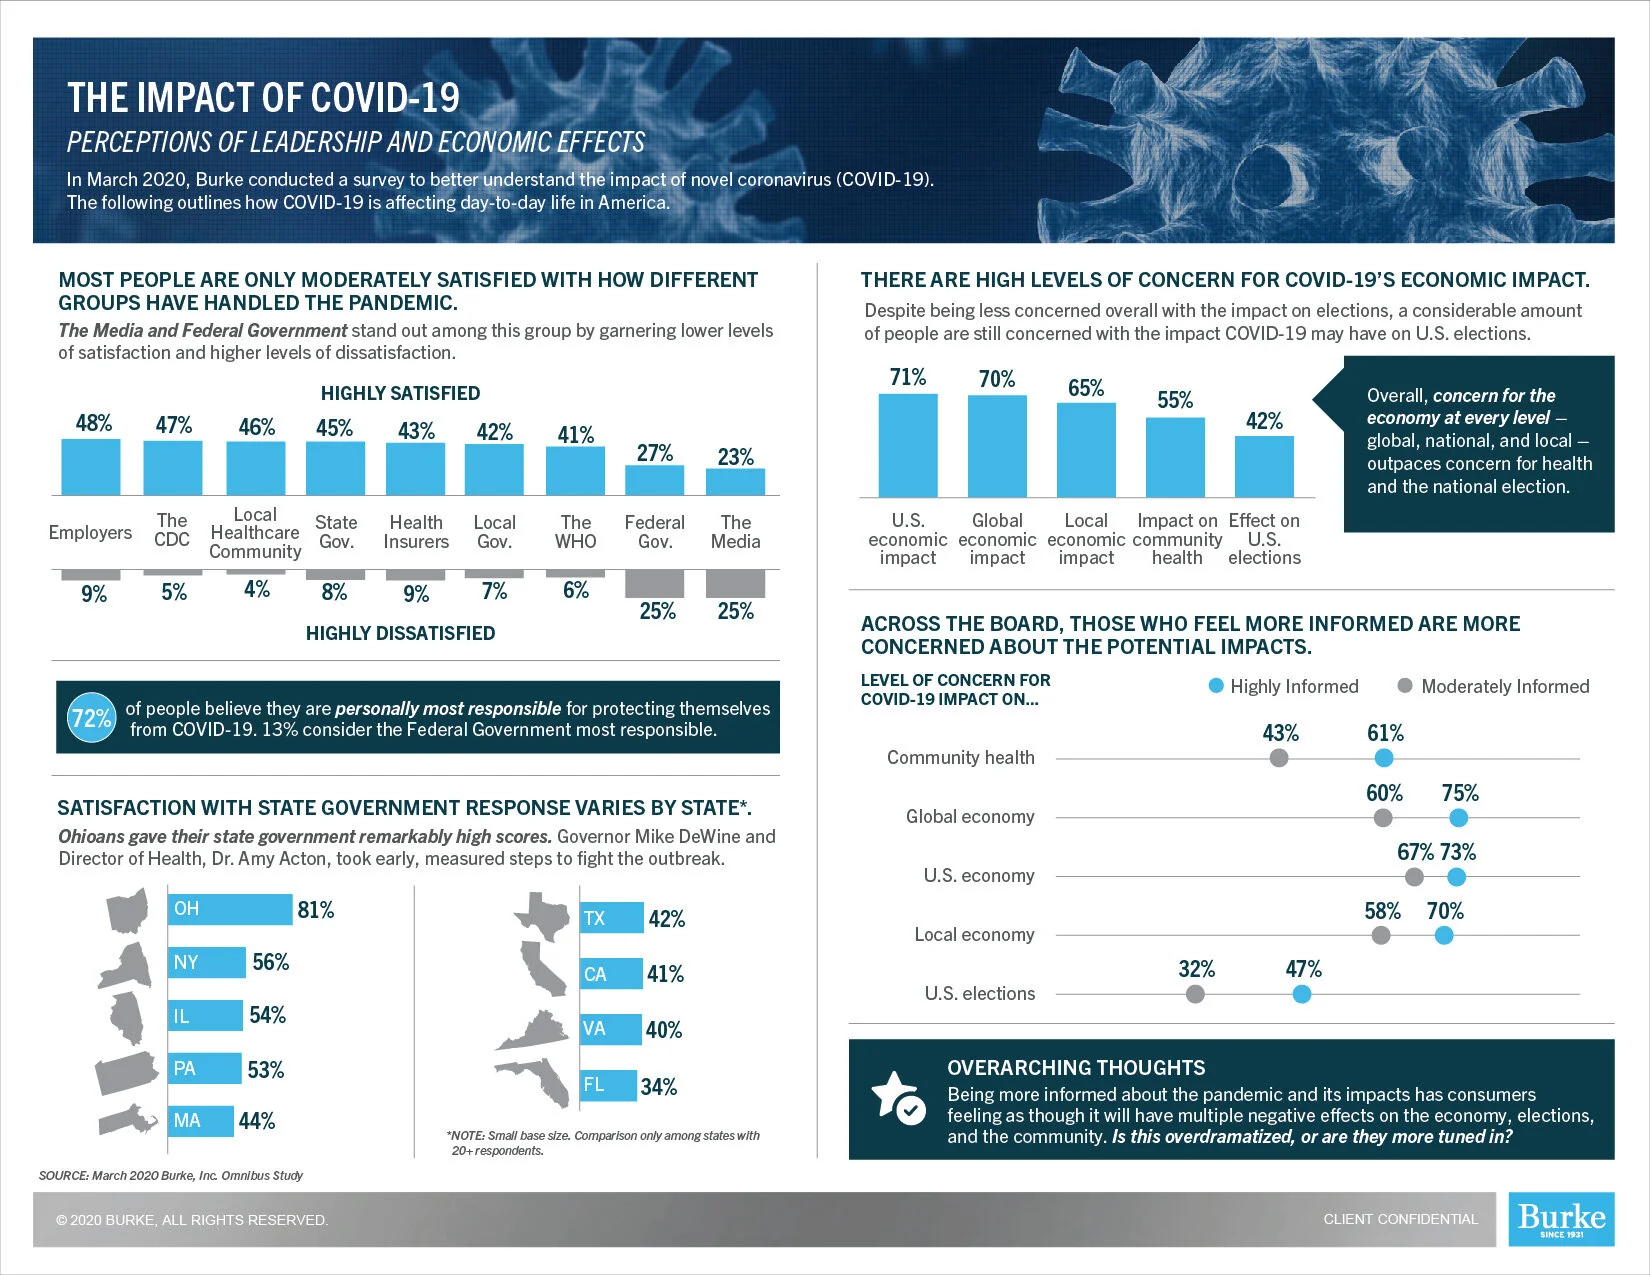
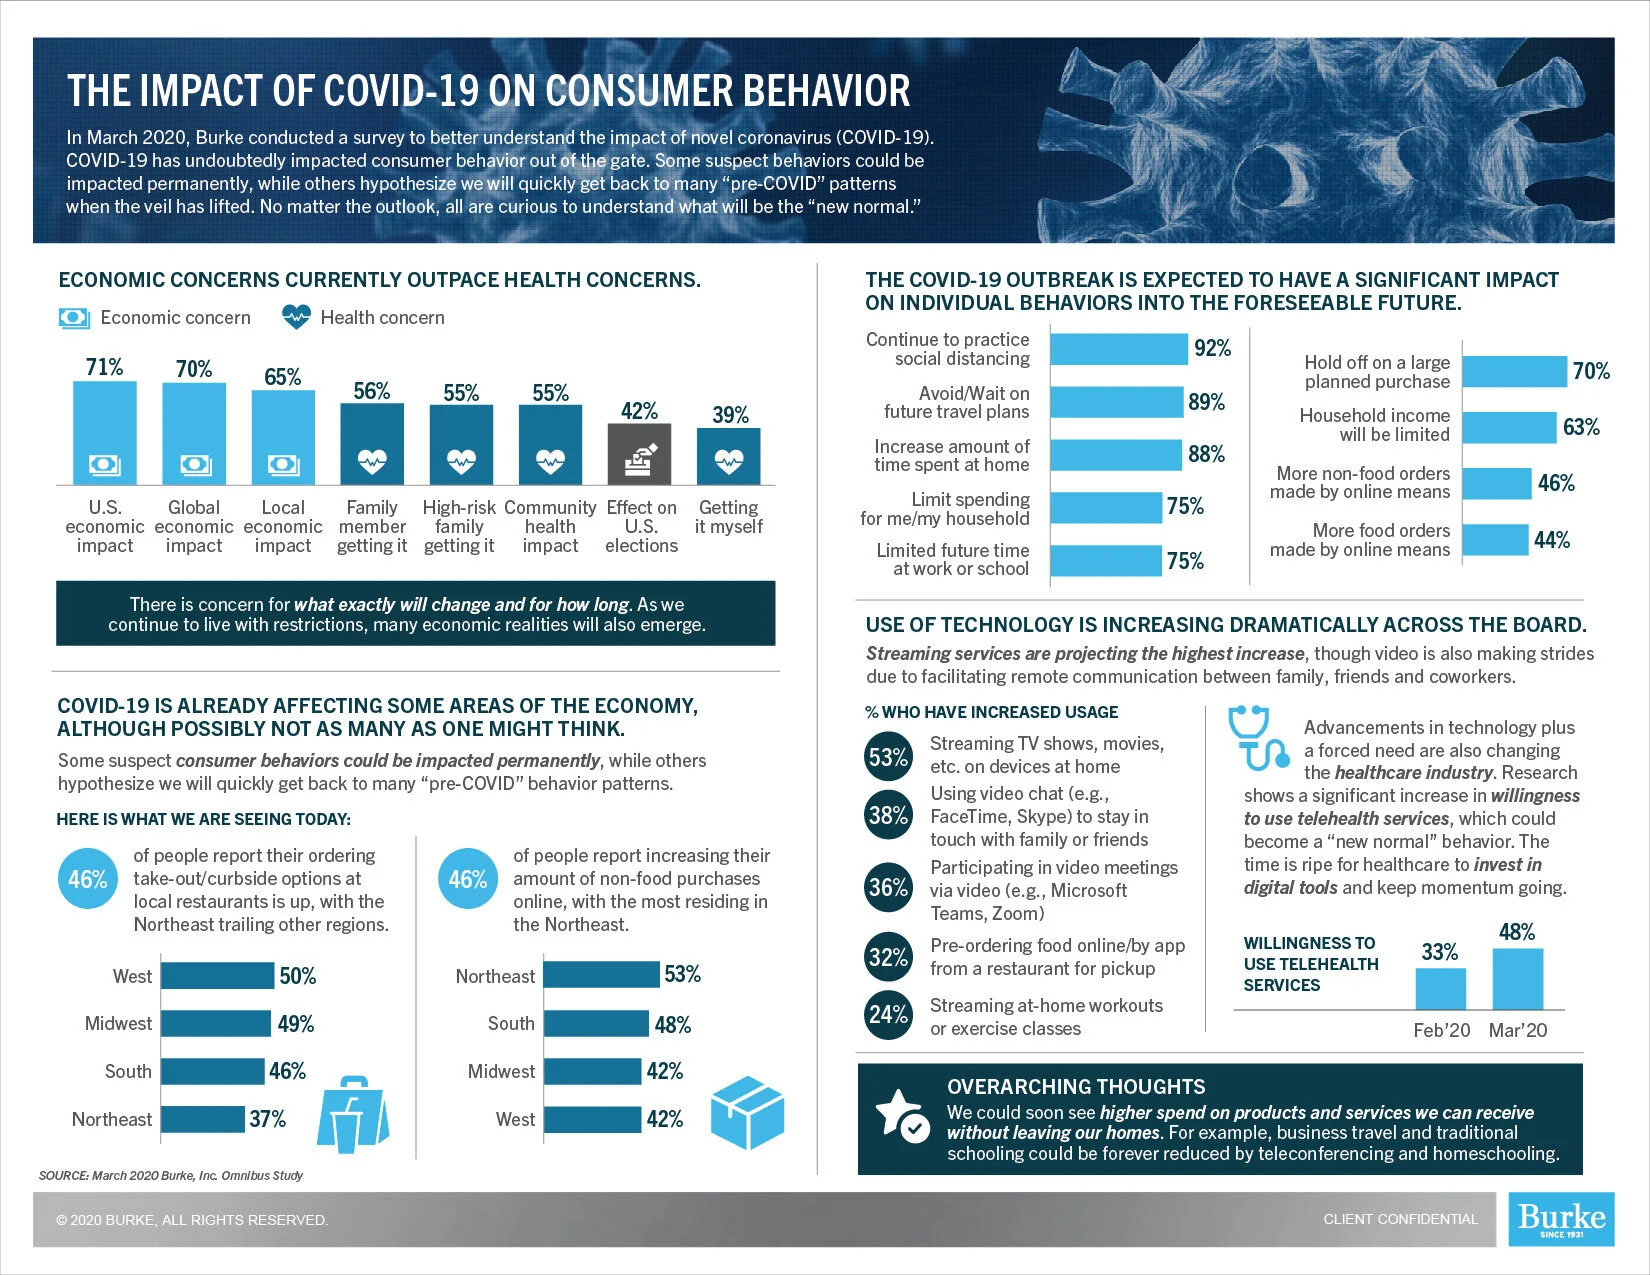
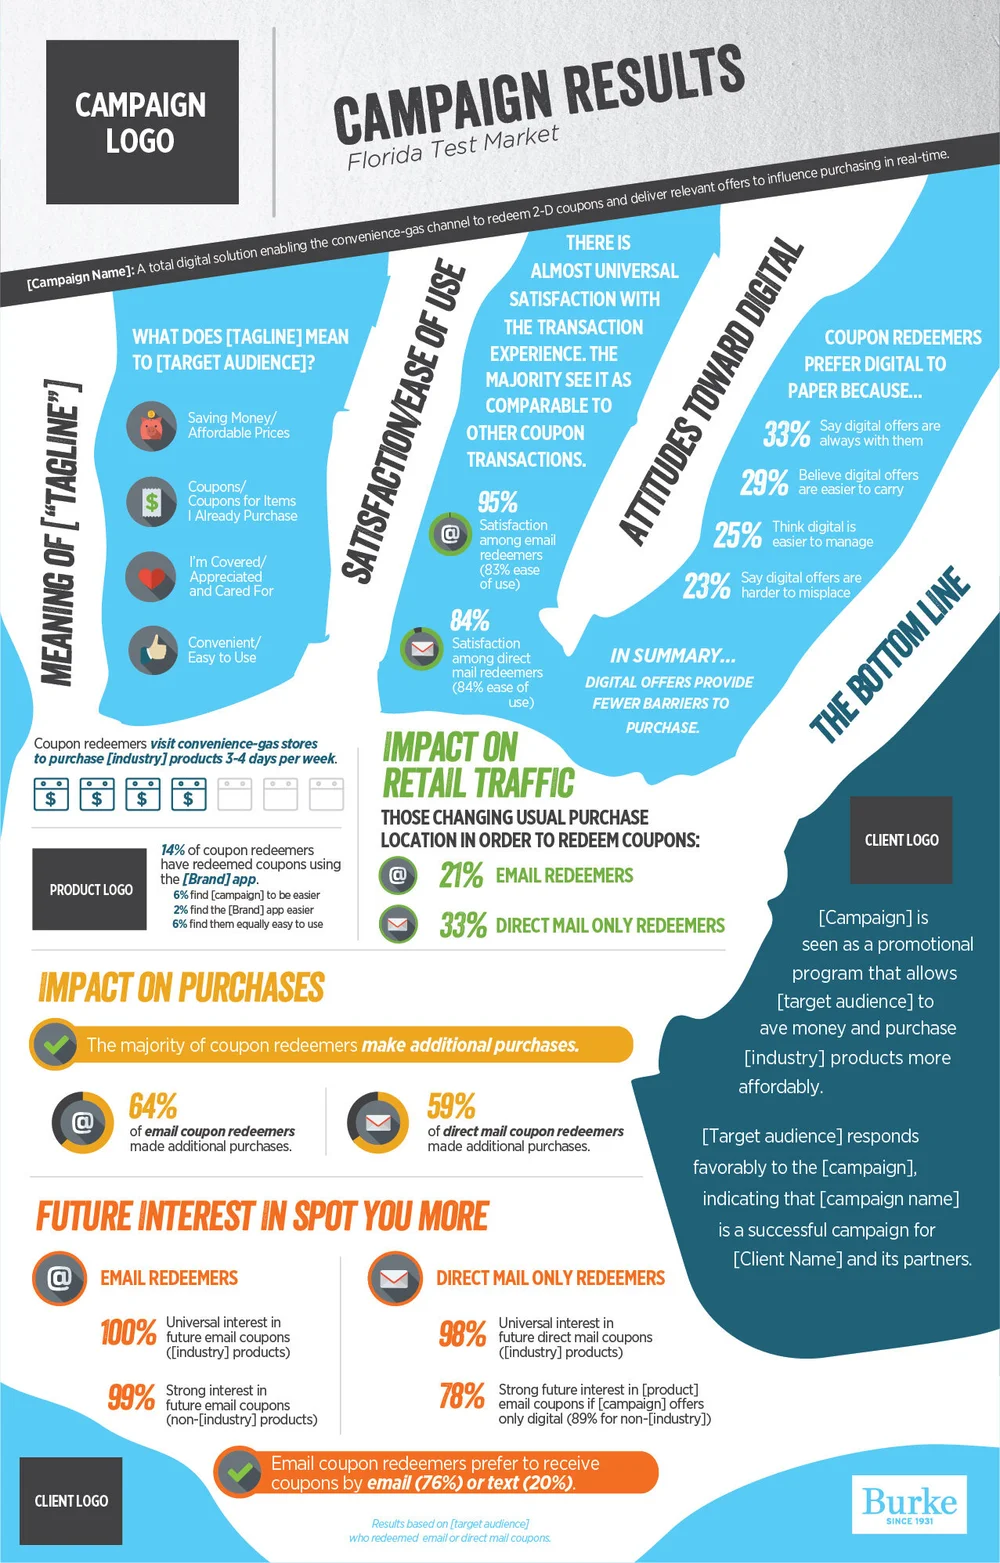
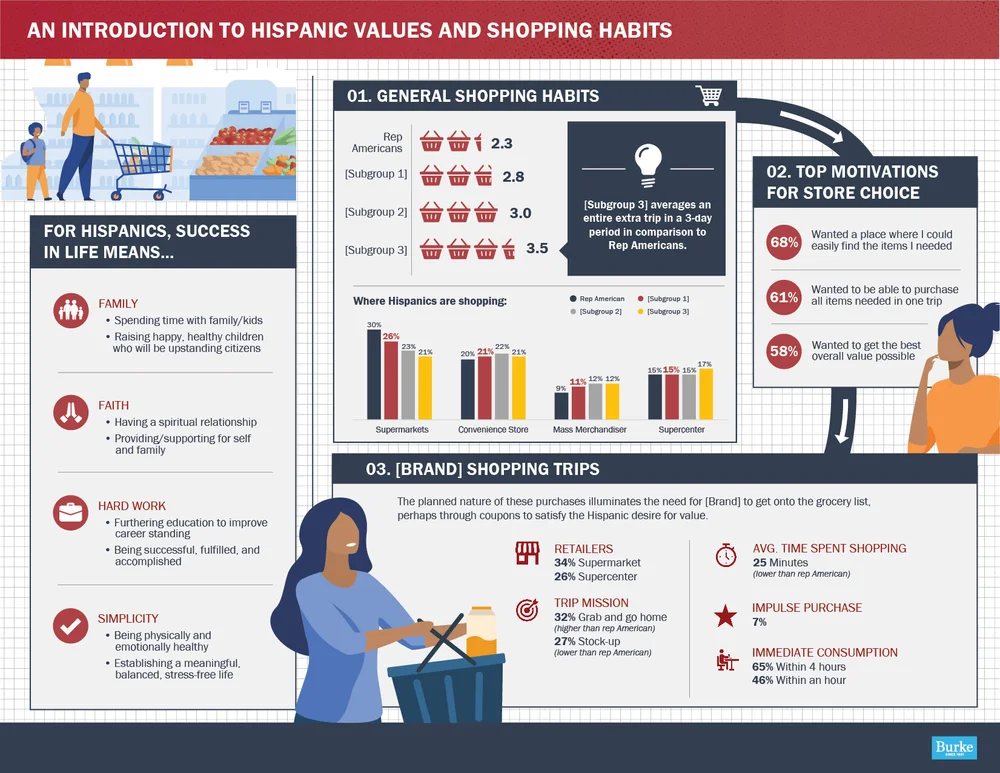
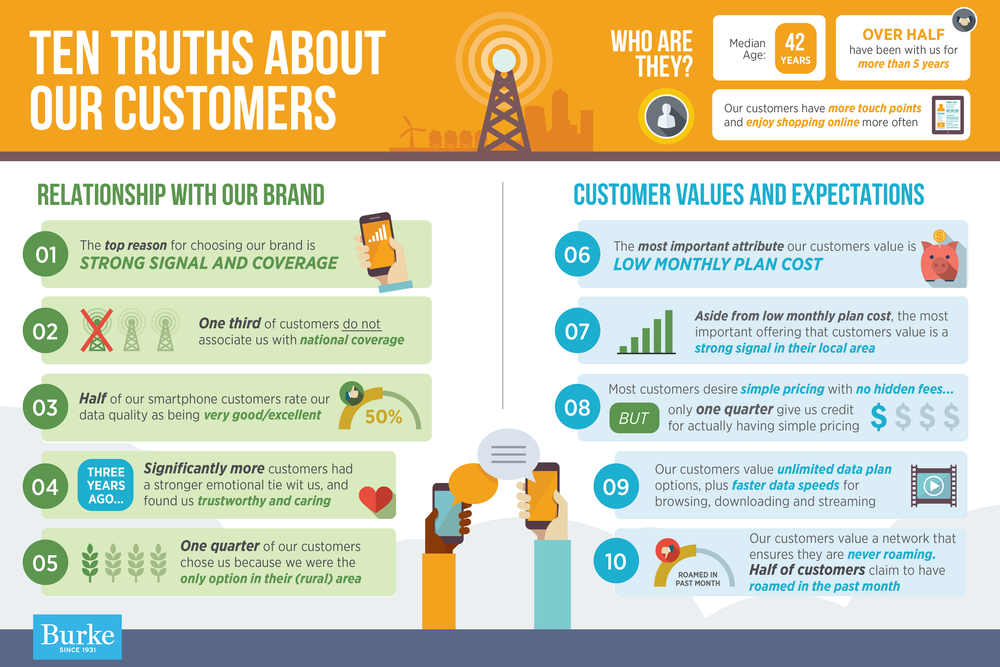
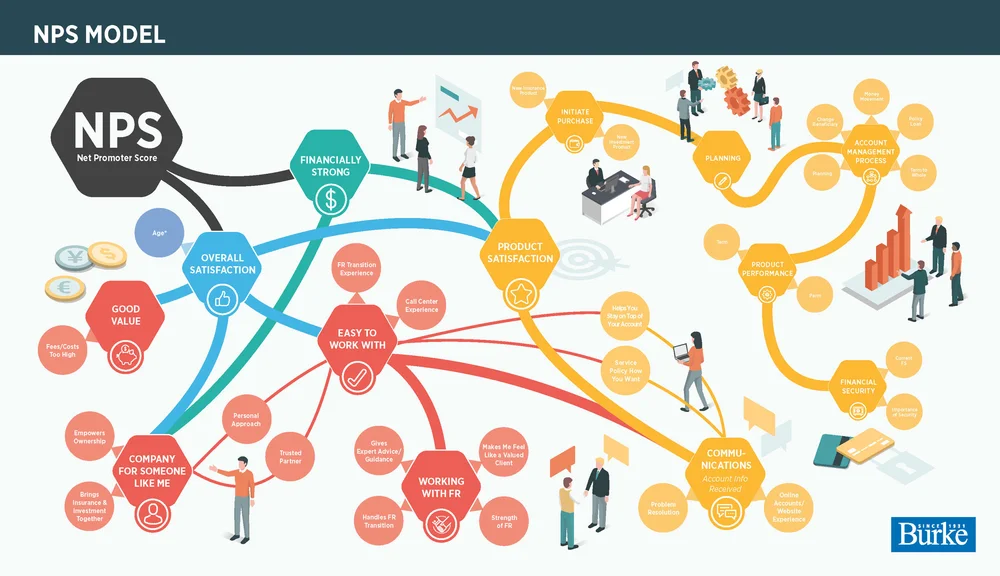
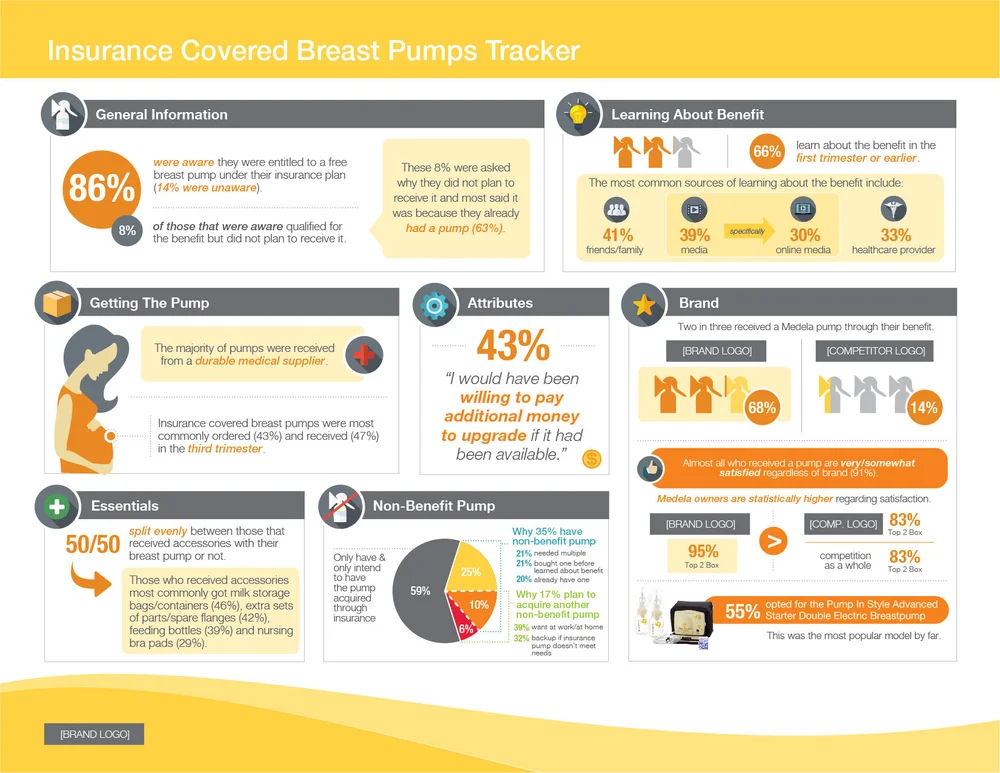
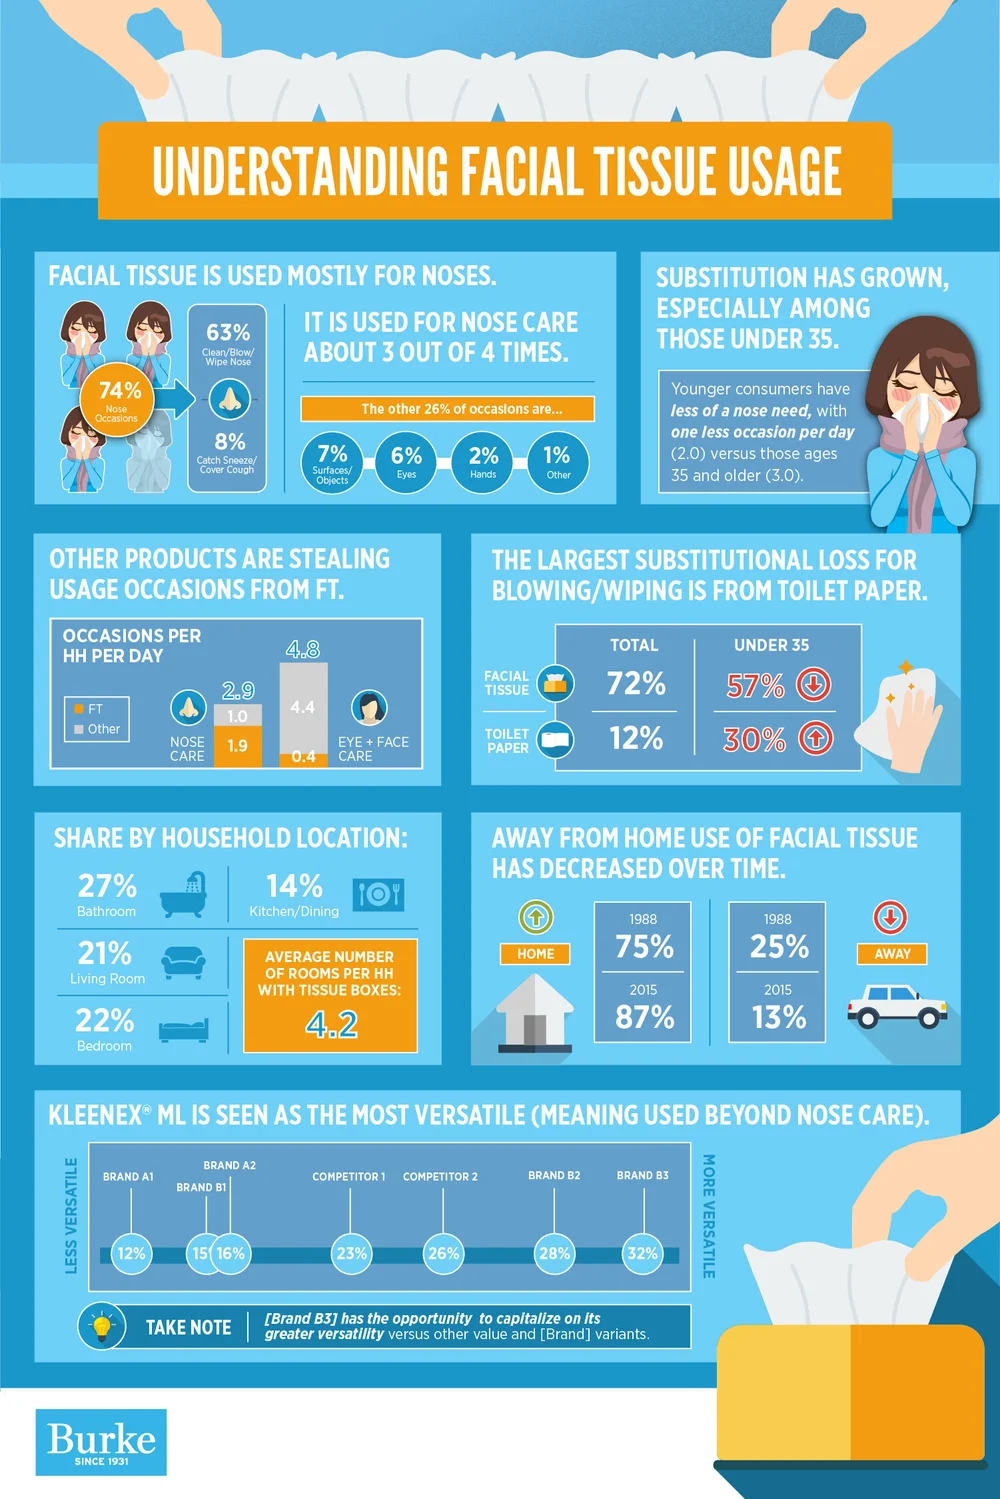
I joined Burke, Inc., a midsize marketing research and insights firm, as their first designer — tasked with elevating client-facing deliverables. I developed visual, story-driven insights presentations, reports, and infographics that clients could share across their organizations to foster understanding and buy-in.
**PLEASE NOTE THAT ALL EXAMPLES ON THIS PAGE HAVE BEEN SANITIZED FOR CONFIDENTIALITY.**
ROLE EXPANSION
My role quickly expanded from supporting Data Analytics to serving Marketing, Sales, and Product Development — individually fielding any and all design needs across a 500-person company. Work spanned client reporting, marketing collateral (website, brochures, social), sales enablement (proposals, one-pagers, sell sheets), and UI for Digital Dashboard products.
ADAPTING TO REPORTING FOR MARKETING RESEARCH
I partnered with both internal and external stakeholders to gauge audience needs and deliver succinct, highly visualized insights that resonated with stakeholders at all levels. In my time at Burke, I gained deep familiarity with marketing research analysis and reporting methods and how to visualize them: Customer and Employee Experience, Brand Tracking, Segmentation, Customer Journey Mapping, and much more.